StatsD and You
The easy way to get application level metrics

http://cleverdomain.org/yapc-statsd/
Who am I?

Who are you?
- Developers
- Who maintain apps that people depend on
- Who are “on-call” to some degree
What’s this about?
- StatsD
- And Graphite, kind of.
- StatsD works with other things
- I’ll be showing Graphite
More sources here and here
StatsD is a metrics aggregation system originated by Flickr and implemented by StatsD a few years ago
What can I do with StatsD?
- Find out
- when things happen
- how often things happen
- how long things take
- what’s happening right now
- when things changed
realtime and historical views both useful when debugging a problem
What can I do with StatsD?
- Find out
- how your app is performing
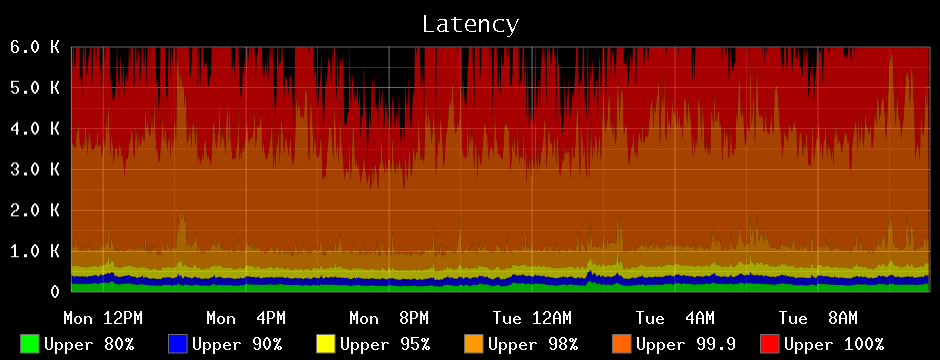
This is a graph of how long some service call takes — point out percentiles
What can I do with StatsD?
- Find out
- how your app is performing
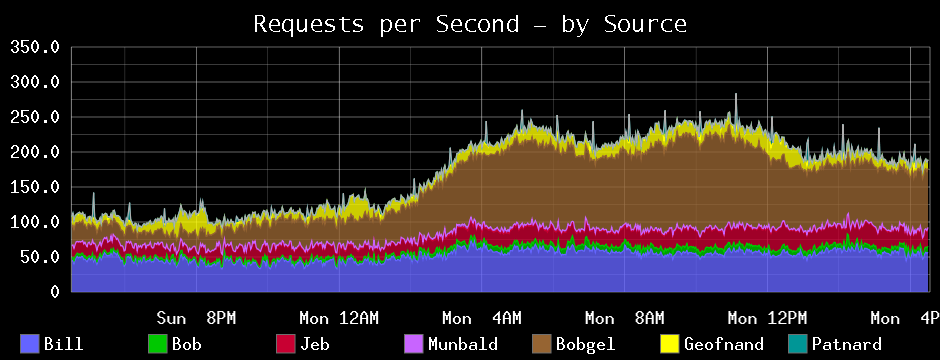
This is a graph of the number of hits to some service — see how busy it is and how the load breaks down among different sources
StatsD features
- Accepts measurements from all over your network with UDP
- Counters
- Timers
- Sets (count uniques)
- Gauges
- Aggregates them into 10-second chunks
- Sends them off to somewhere that will store the data
- Counters: how many times does some event happen
- Timers: how long does something take to do?
- Sets: register a pageview with each username and find out how many different users viewed pages
- Gauges: for global, slow stats like resource usage or % completion of a process
Installing Statsd
npm install -g statsd
statsd exampleConfig.js
Installing Graphite
- Carbon
- Whisper
- Django
- mod_wsgi
- Graphite-Web
- No distribution packages for most of it
- Sorry :(
Installing Graphite
- I ended up using Chef
- You can get it for most systems
- You can use Chef-solo without any servers
- It will install Graphite and all the requirements for you
- Cookbook docs
How does it integrate with my app?
Clients for every language means all your apps can send data the same place even if you use lots of languages. Net::Statsd::Client is my module created with help from Shutterstock.
Net::Statsd vanilla
use Net::Statsd;
$Net::Statsd::HOST = "stats.example.com";
sub login {
Net::Statsd::increment("myapp.logins");
}
Global variables are meh :(
Net::Statsd::Client
use Net::Statsd::Client;
my $stats = Net::Statsd::Client->new(
server => "stats.example.com",
prefix => "myapp.",
);
sub login {
$stats->increment("logins");
}
Prefix for DRY, namespacing, possiblity of loading config from Dancer config or similar
Net::Statsd timing
use Net::Statsd;
$Net::Statsd::Server = "stats.example.com";
use Time::HiRes qw(tv_interval gettimeofday);
sub get_something {
my $start = [gettimeofday];
my $client = Service::Client->new;
my $data = $client->get("some stuff");
my $elapsed = tv_interval($start);
Net::Statsd::timing("myapp.get_something.elapsed",
int($elapsed * 1000));
return $data;
}
Lots of repeated boilerplate around timing. What’s the right multiplication factor? Statsd uses ms.
Net::Statsd::Client timing
use Net::Statsd::Client;
my $stats = Net::Statsd::Client->new(
  server => "stats.example.com",
  prefix => "myapp.",
);

sub get_something {
  my $timer = $stats->timer("get_something.elapsed");
  my $client = Service::Client->new;
  my $data = $client->get("some stuff");
  $timer->finish;
  return $data;
}
Timer object abstracts away timing, warns if →finish or →cancel not called because it indicates an uncovered piece of code
Sampling
Do you have that many events? Okay.
use Net::Statsd::Client;
my $stats = Net::Statsd::Client->new(
server => "stats.example.com",
prefix => "myapp.",
sample_rate => 0.01,
);
Override per-event if you like.
$stats->increment("lines_of_code_executed", 0.0001);
For counters, statsd automatically scales with sample rate so everything is consistent
Graphite Tricks
No time to go into them :(
Look on the internet for info on making pretty graphs and dashboards.
One clever trick: for rare events like deploys, use drawAsInfinite to get a vertical line for each event.
Thanks!